How to use the tool (60 seconds)
No login, no install, nothing stored. Open it, type your college's numbers, read your scorecard.
Open the tool
Click “Open the free NIRF tool”. It runs in your browser.
Enter your data
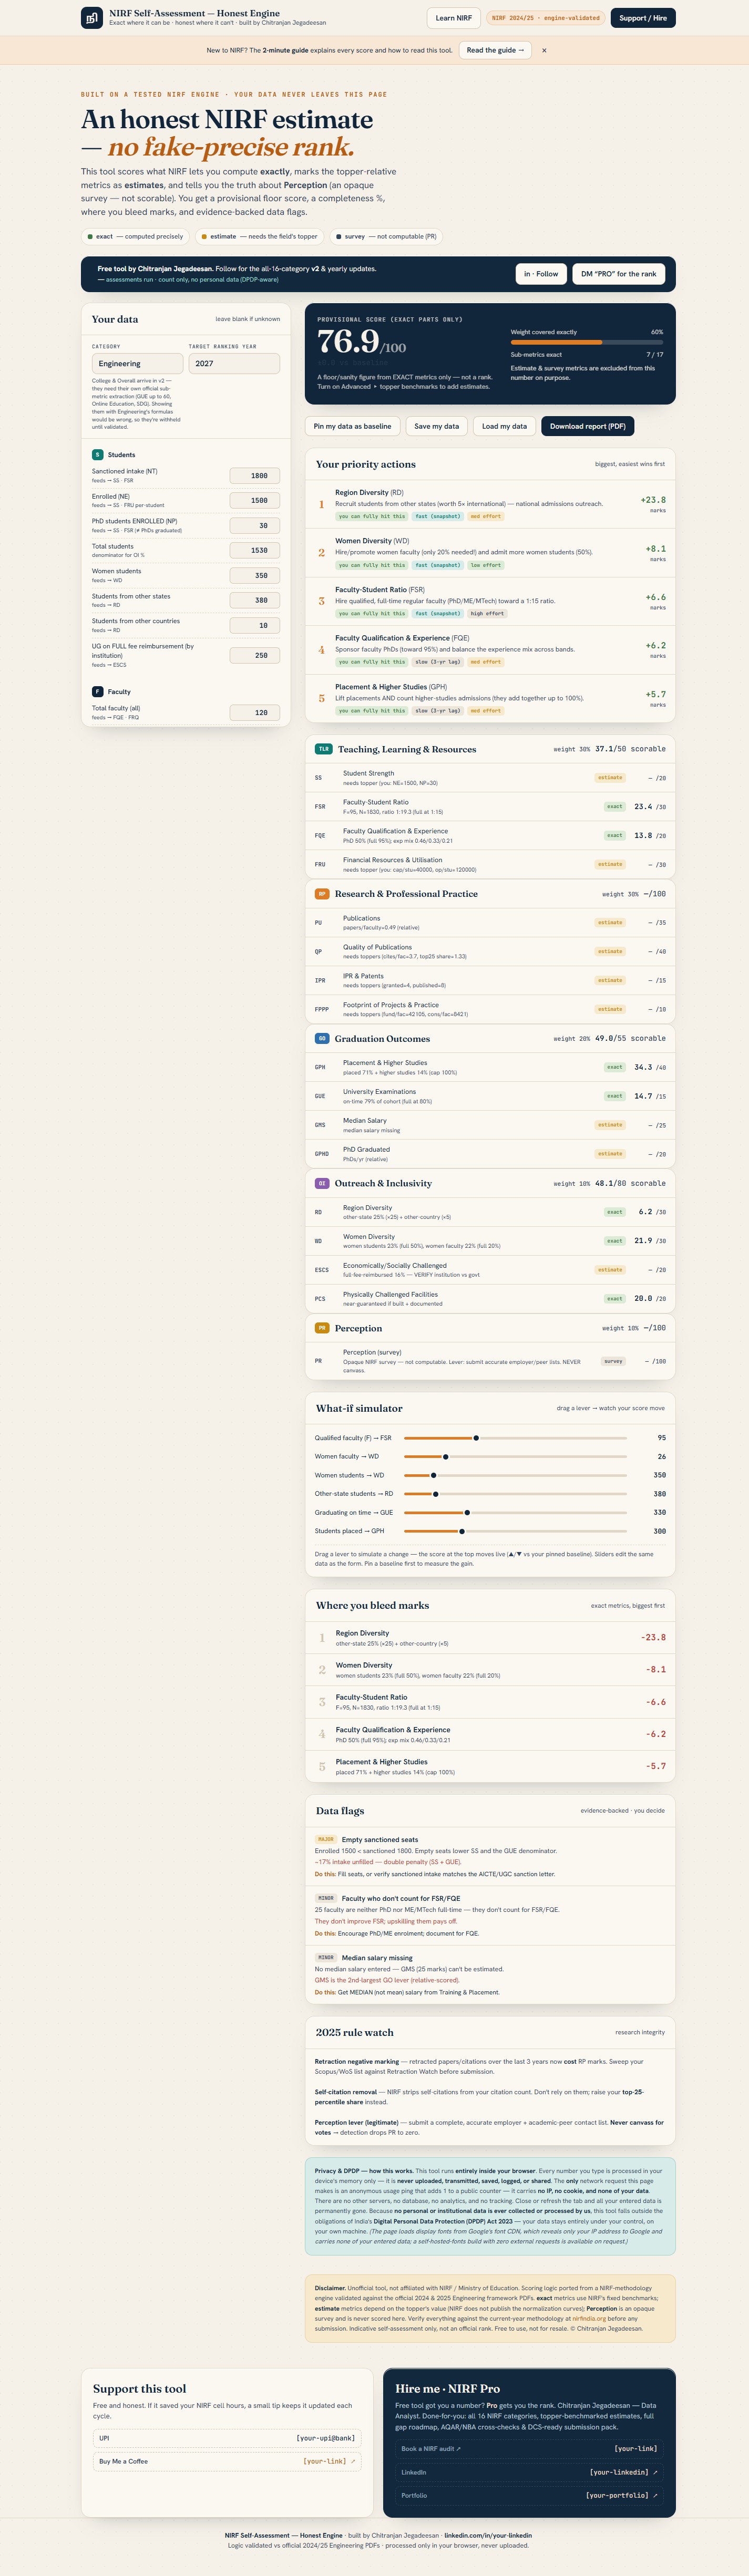
Fill the yellow fields — students, faculty, research, outcomes. Each field shows which score it feeds.
Read your scorecard
See your provisional score, what’s exact vs estimate, and where you bleed marks.
Act & export
Use the priority actions + what-if sliders, then download a PDF report.
NIRF 360 — every parameter in plain English
NIRF scores five areas, each out of 100, then weights and adds them into one score out of 100. Here’s what each measures and how the marks split (Engineering category).
Teaching, Learning & Resources
30%- SS (20) — student strength incl. PhD
- FSR (30) — faculty–student ratio (target 1:15; biggest single sub-metric)
- FQE (20) — % PhD faculty + experience mix
- FRU (30) — money actually spent per student
Research & Professional Practice
30%- PU (35) — publications per faculty
- QP (40) — citations + top-25% share (the rank-mover)
- IPR (15) — patents (granted worth 2× published)
- FPPP (10) — research funding + consultancy
Graduation Outcomes
20%- GPH (40) — placement + higher studies
- GUE (15) — on-time graduation (target 80%)
- GMS (25) — median salary
- GPHD (20) — PhDs graduated
Outreach & Inclusivity
10%- RD (30) — other-state/country students
- WD (30) — women students (50%) & faculty (20%)
- ESCS (20) — fee-reimbursed students
- PCS (20) — accessibility facilities
Perception
10%- PR (100) — employer + academic-peer survey. Opaque and not computable — the only honest lever is submitting accurate contact lists. Never canvass (= zero).
The formula
- Composite = TLR×0.30 + RP×0.30 + GO×0.20 + OI×0.10 + PR×0.10
- Relative scoring: most metrics are scaled to the topper — you’re racing other colleges, not a fixed target.
What changed in NIRF 2025
Self-citations removed — you can’t inflate citations by citing yourself.
New SDG ranking — a separate list rewarding sustainability work.
NEP 2020 rewards — multiple entry/exit, Indian Knowledge Systems, regional-language teaching.
3-year public data hosting — submitted numbers must stay public for 3 years (mismatches get flagged).
FAQ
Is this an official NIRF score?
No — it’s an unofficial self-assessment estimate. NIRF doesn’t publish its normalization curves, so no tool can promise an exact rank. Always verify against the official methodology at nirfindia.org.
Does the tool store my data?
No. It runs entirely in your browser; your numbers are never uploaded or saved, and disappear when you close the tab — keeping it outside India’s DPDP Act obligations. The only network call is an anonymous “+1” to a usage counter (no IP, no cookie, no data).
Which categories are supported?
The tool is validated for the Engineering category. College & Overall (with their different sub-metric splits) are planned for v2.
Ready to see where your college stands?
Free · honest · nothing stored. Then follow for the all-16-category v2.